
I’ve created a new R function called spreadPoints, in my basicPlotteR package.
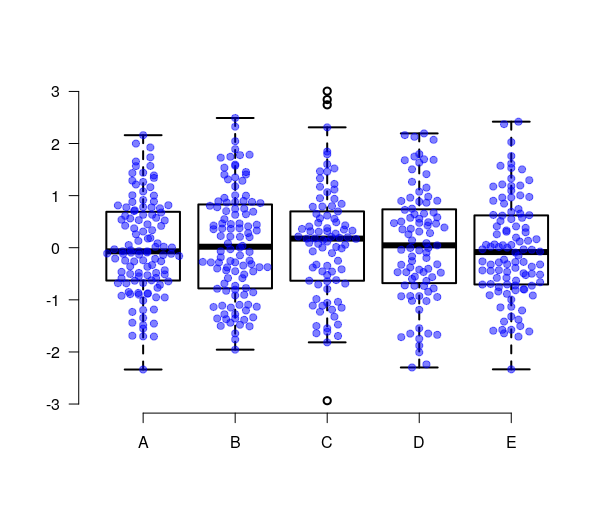
The spreadPoints() function is designed to add points onto an existing boxplot. The points are spread out to avoid overlap. It works a lot like the stripchart, but it doesn’t spread points randomly. Here it is at work in R:
There is still work to be done on this function but give it a go and let me know what you think. You just need to download my basicPlotteR package:
# Install the devtools package to install packages from GitHub
install.packages("devtools")

# Install my basicPLotteR package directly from GitHub
devtools::install_github("JosephCrispell/basicPlotteR")

# Load it!
library(basicPlotteR)

# Generate some example points - drawn from exponential distribution
values <- rnorm(n=50)

# Plot a boxplot
boxplot(values, xlab="",  ylab="", frame=FALSE, las=1, pch=19)

# Plot the points spread along the X axis
spreadPoints(values, position=1, col="blue")
The spreadPoints() function works with the following steps:
- Split the
Yaxis into equally sized bins - Assign each
Ypoint into a bin - Examine each
Yaxis bin:
a. Count the points in current bin
b. Split theXaxis space available, to give the same amount of space to each point
c. Working from the middle, work out left and right assigning each point a newYcoordinate - Plot the points with modified
Yvalues
Well hopefully that’s a helpful addition to the basicPlotteR package. Showing the underlying points on a boxplot is very important, particularly when there are only a few points available and I wanted a method that was non-random.
Still plenty of work to do on this, so give it a go and let me knwo what you think! 😊