I’ve recently added the radarChart() function into my basicPlotteR R package. Radar Charts provide a way that we can map scores in different qualitative categories.
I am currently developing my Personal Development Plan and I wanted to reflect on my current skills and what I’d like to develop.
I was inspired to learn more about the radar chart by the existing radarchart() function in the fmsb R package. The key to the radar chart is positioning the axes equidistantly around a circle, and thanks to Stackoverflow, I didn’t have to work this out myself! 💡
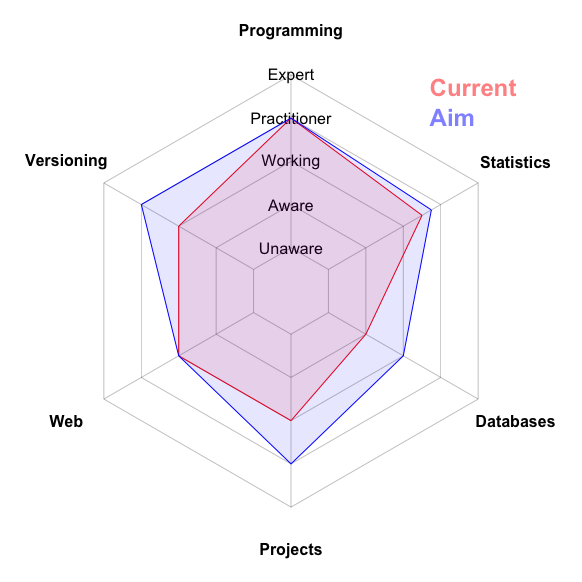
Here is my radarChart() function in action illustrating my current level for a range of skills and where I’d like to be over the next 6 months:
# Create a chart illustrating my current skills levels
radarChart(scores=c(4,3.5,2,3,3,3),
           names=c("Programming", "Statistics", "Databases", "Projects",
                   "Web", "Versioning"),
           levels=c("Unaware","Aware","Working","Practitioner", "Expert"))

# Add where I aim to get to
radarChart(scores=c(4,3.75,3,4,3,4),
           names=c("Programming", "Statistics", "Databases", "Projects",
                   "Web", "Versioning"),
           levels=c("Unaware","Aware","Working","Practitioner", "Expert"),
           polygon.col="blue", add=TRUE)

# Add a legend
legend("topright",
       legend=c("Current", "Aim"),
       text.col=c(rgb(1,0,0, 0.5), rgb(0,0,1, 0.5)),
       bty="n", text.font=2, cex=1.5, xpd=TRUE)
I consider these themes to be integral to my work as a data scientist and over the next 6 months I’ll be doing the following to improve my skills:
- Programming - I’m happy where I am at the moment. I can confidently program in a range of languages.
- Statistics - A skill I’d like to improve. Currently I’m learning about geospatial statistics and Small Area Estimation techniques to extrapolate statistics to small local areas with limited sampling.
- Databases - I’ve worked with big data sources for many years, but not much with databases. I’d like to learn more about how we create, manage, and query large databases. I’m getting started by using MySQL to store and query trade statistics data.
- Projects - As a data scientist, I’m involved in many different projects. Managing my own and other’s time is becoming increasingly important. I’ve just completed a Scrum Master training course and I am excited to learn more!
- Web - Web development is essential to disseminating and exploring data and an area I need to improve but for the moment I am happy with my current skill level. Most recently I used the
htmlpresentation framework reveal.js for a presentation about Data Ethics in practice. - Versioning - Understanding version control and writing high quality robust code is something I am continually working on. At the moment I am exploring unit testing and I’d like to learn more about GitHub Actions.
For me, this has been a really useful exercise. Taking time to reflect on my current skills and learning about the mathematics behind radial charts. The code for my radarChart() function is available here. Install my basicPlotteR package and give it a go! 🏁