
Recently I have been working with maps - trying to understand where all my samples are coming from. To do this I wanted to plot my sampling locations on top of a map. After fiddling with a number of different ways to get maps in R, I have happily fallen upon the OpenStreetMap package.
A great package that can return a map in a variety of styles. Also, all the maps are open source and available to everyone for free!! Here is some code to get you started:
# Load required libraries
library(OpenStreetMap) # I had to run sudo R CMD javareconf to get rJava to load

# Note latitude and longitude of location
upperLeft <- c(56.022457,-4.5969357)
lowerRight <- c(56.014888,-4.5780147)

# Get a satellite image of area of interest
map <- openmap(upperLeft=upperLeft,
               lowerRight=lowerRight,
               type="bing")

# Plot the map
plot(map)
You’ll get the following image - this is where Joanna and I got engaged! 💍 On the shores of Loch Lomond, just outside Glasgow.
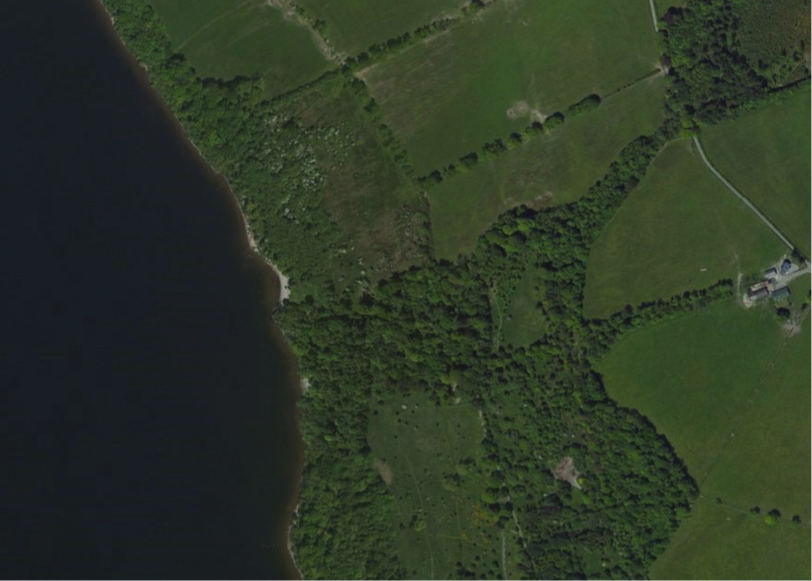
Using the type parameter of the openmap() function, you can change the style of the map being returned. The “bing” option returns a satellite image of the map - my favourite!
Sometimes, if a particular area isn’t available in a certain style, you’ll get an error something like this:
Error in osmtile(x%%nX, y, zoom, type) : could not obtain tile: ...
You can try different options for the type parameter to fix this issue. I quite like the "opencyclemap" option. Here is a great tutorial that you can a bit more help from. Enjoy!
One thing you’ll have to get use to is hopping between different map projections (like latitude and longitudes, national grids, or spherical mercator projections). The openproj() is a handy function for converting between projections.