I’ve recently been exploring a survey dataset that is in French. I found a python library googletrans that uses the Google Translate Ajax API to translate text.
So I’ve just started working with Google Apps Script.
My website is a place for me to take note of my interests, both inside and outside of work. I’ll keep adding to, and improving, it!
This time last year, Stephen Gordon and I were furiously writing a grant for funding from the Department of Agriculture, Food & the Marine (DAFM) for their National Research Call.
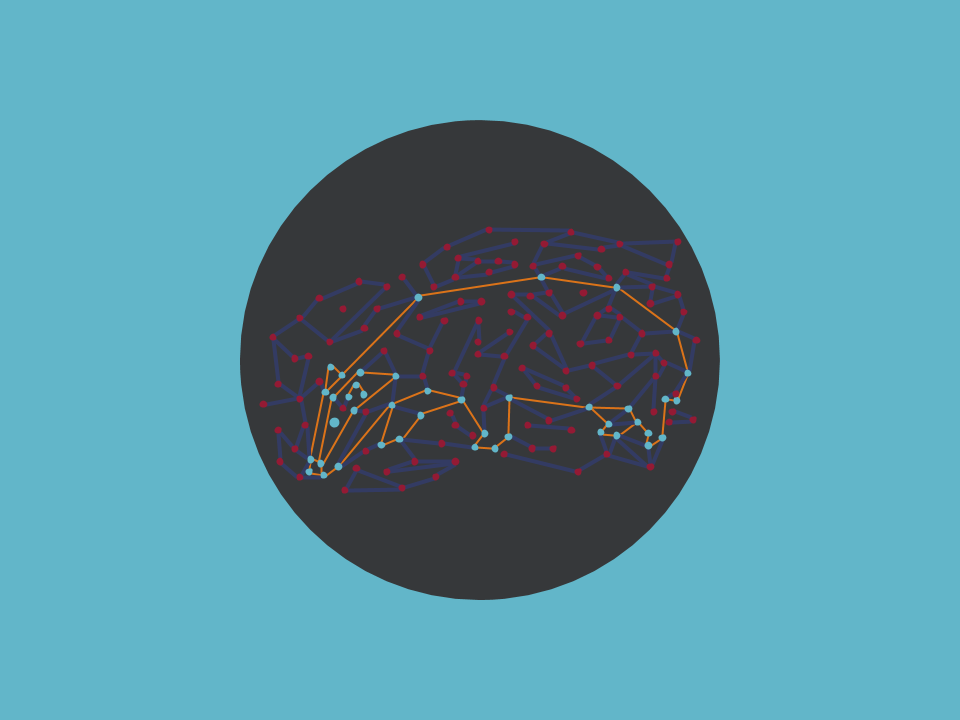
Today, after a huge amount of work over many years, our research using genomics to look at how often Mycobacterium bovis was transmitted within and between cattle and badgers in Woodchester Park has been published!
I’ve been working with phylogenies in R for a long time. I find the ape and phytools to be the most useful.
Teaching data science is one of my passions. Here is where I am going to keep a note of the teaching materials that I’ve developed.
Recently I have been working with maps - trying to understand where all my samples are coming from. To do this I wanted to plot my sampling locations on top of a map. After fiddling with a number of different ways to get maps in R, I have happily fallen upon the OpenStreetMap package.
We’ve all been stuck waiting for a for loop to finish, or a particularly complex function. Over the years I have come across a few revelations when it comes to tracking the progress of my R code. Here they are in the order I found them!
basicPlotteR is an R package designed to help you making plots in base R. The base R package is the package that comes with R, it contains all those functions that makes R what it is.